 Silicon
See what your Apple Silicon is really doing.
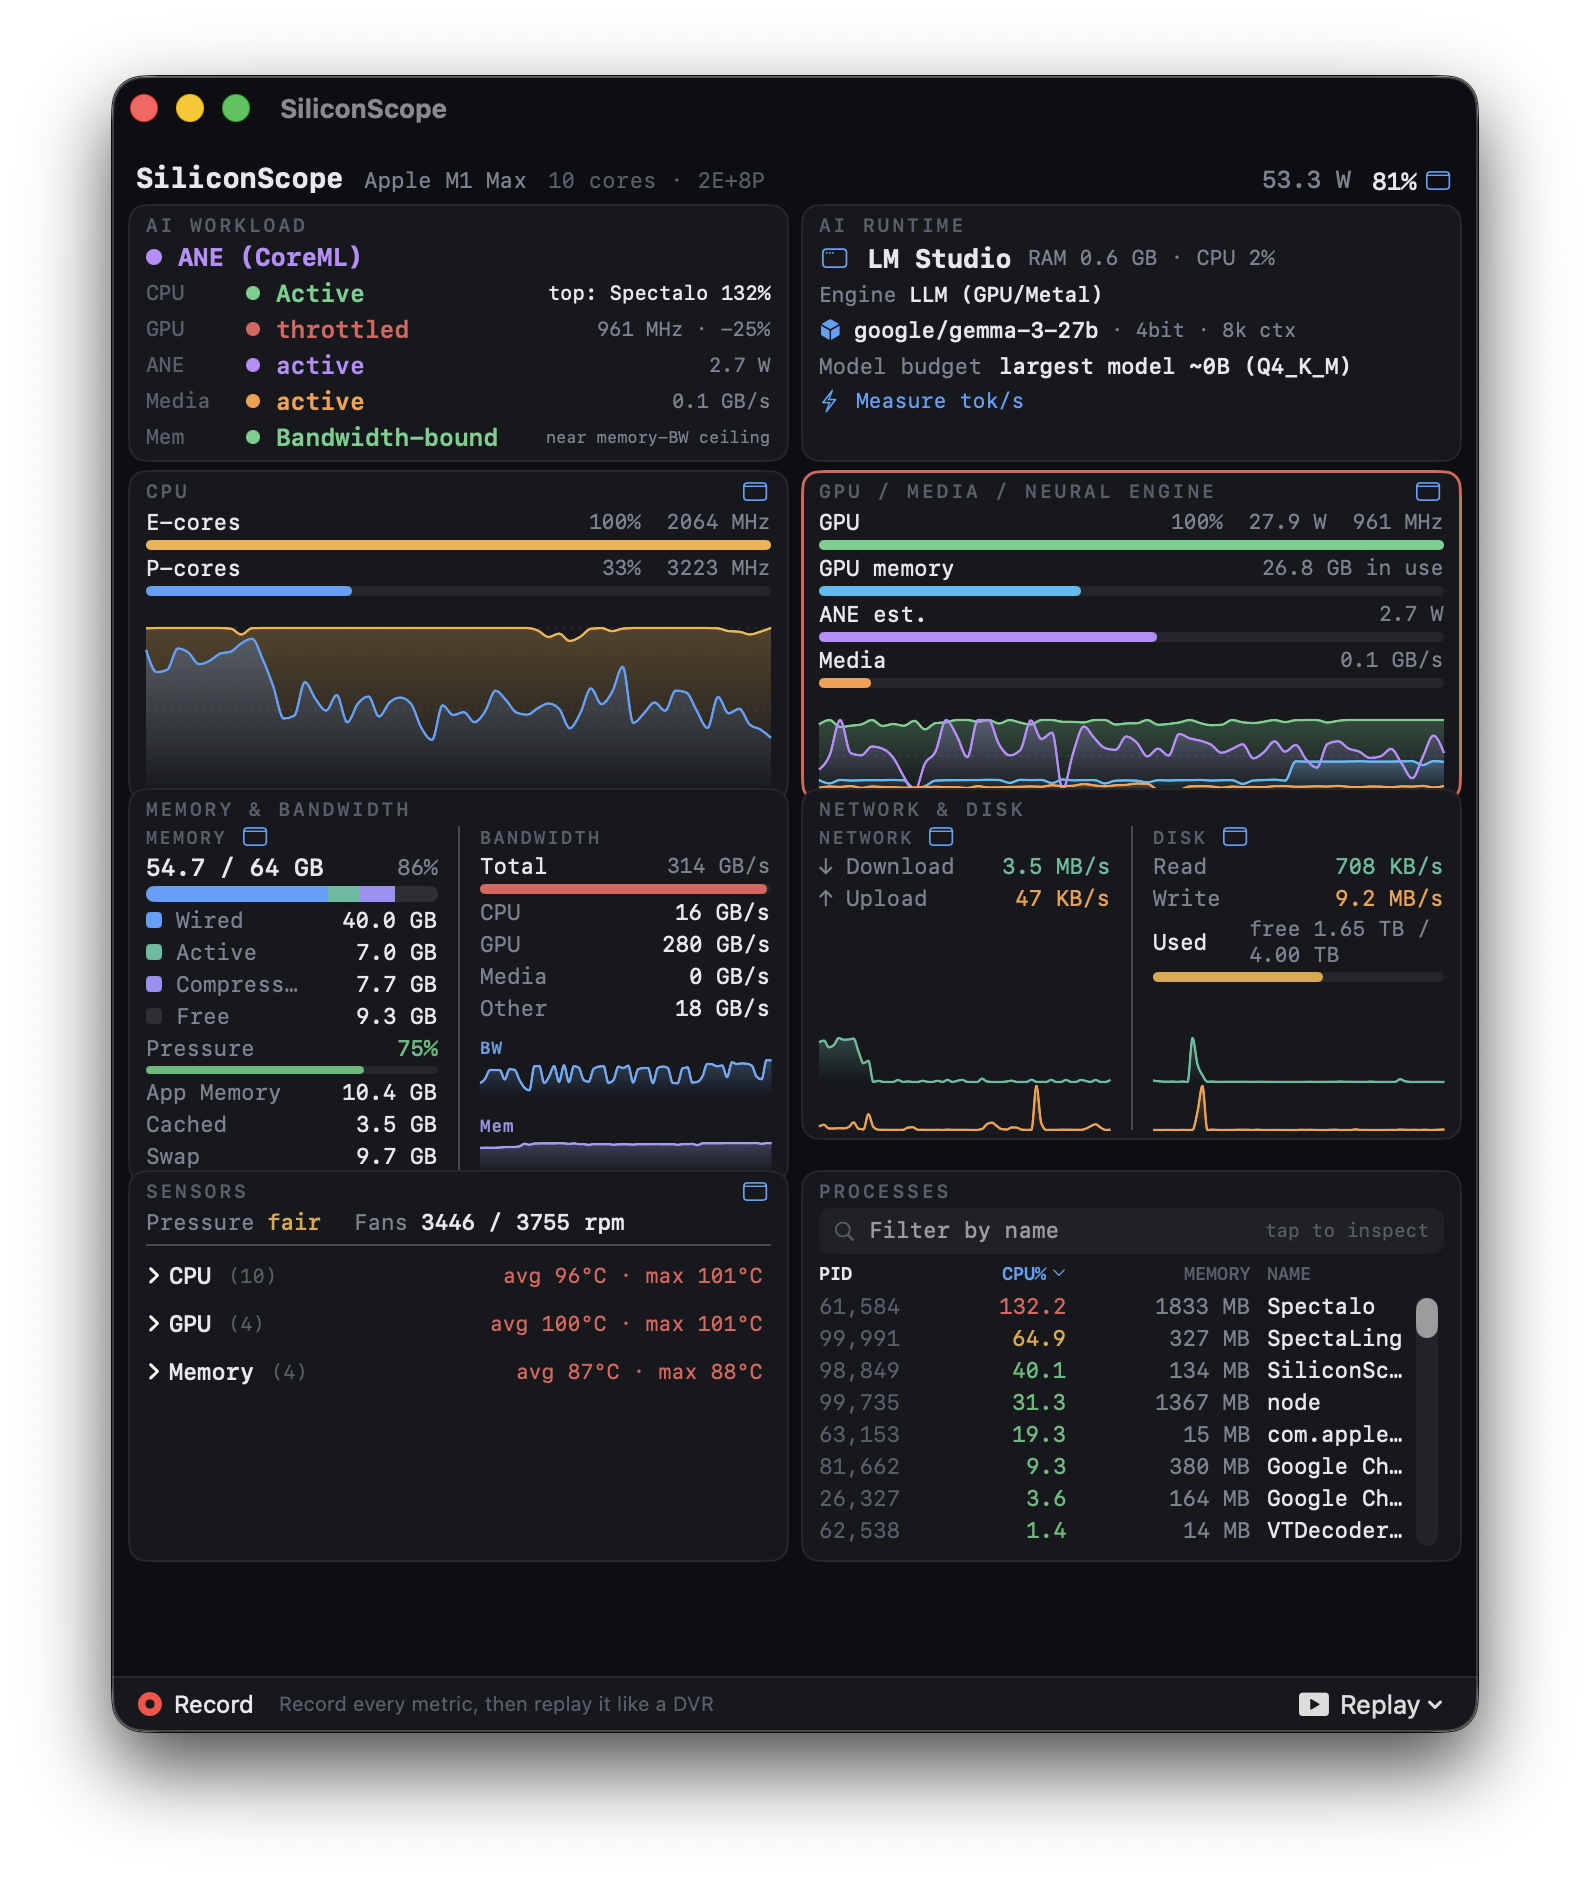
A sudoless macOS monitor with first-class ANE, Media Engine, and memory-bandwidth tracking — the signals Activity Monitor and btop don’t show. Menu bar and full dashboard. New in 4.0: watch your other machines too — headless Macs and Linux GPU boxes, in the same window.
★ 900+ stars on GitHub · thank youFeatured on OWC Rocket Yard · AAPL Ch. · ifun.de
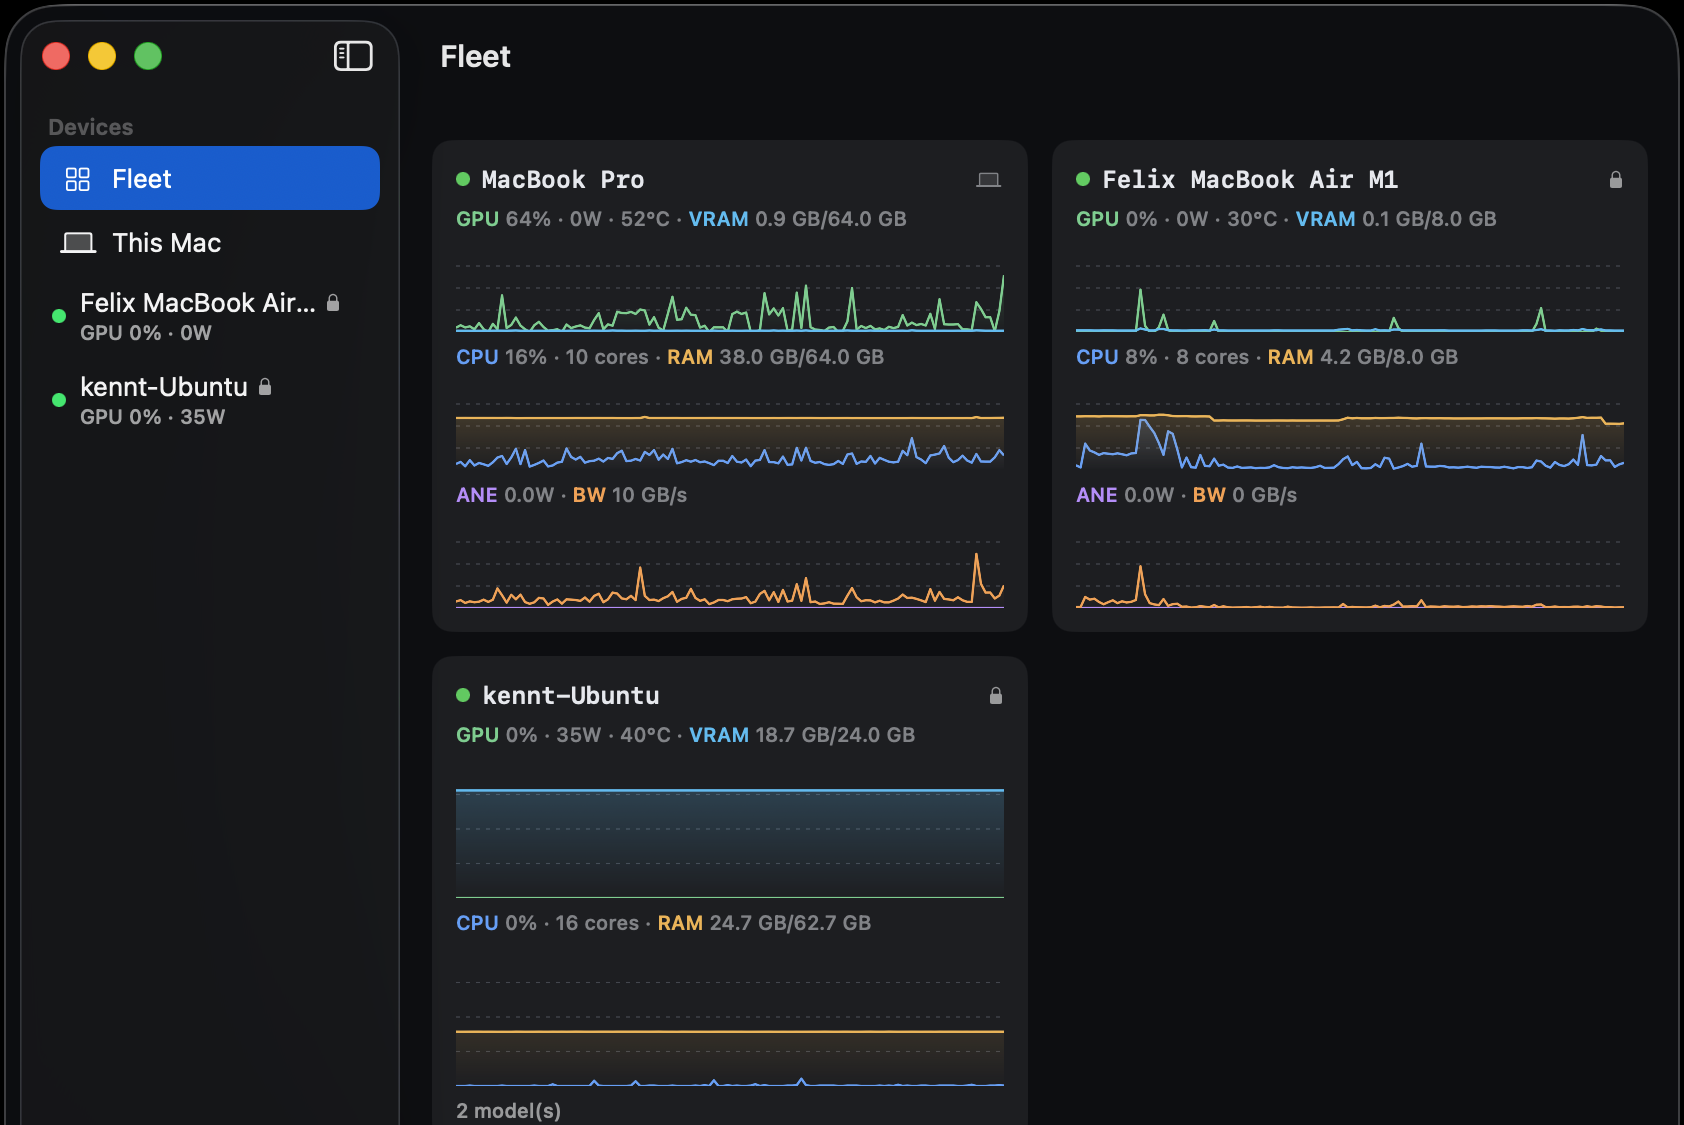
Your other machines, in the same dashboard
A headless Mac mini, a Linux GPU box, a cloud instance — run a small agent there and it joins this dashboard over an encrypted, paired connection. Remote Macs keep the full treatment, Neural Engine included; a Linux/NVIDIA box gets a GPU-centric view with VRAM holders and loaded Ollama models. One line to install, one paste to pair.
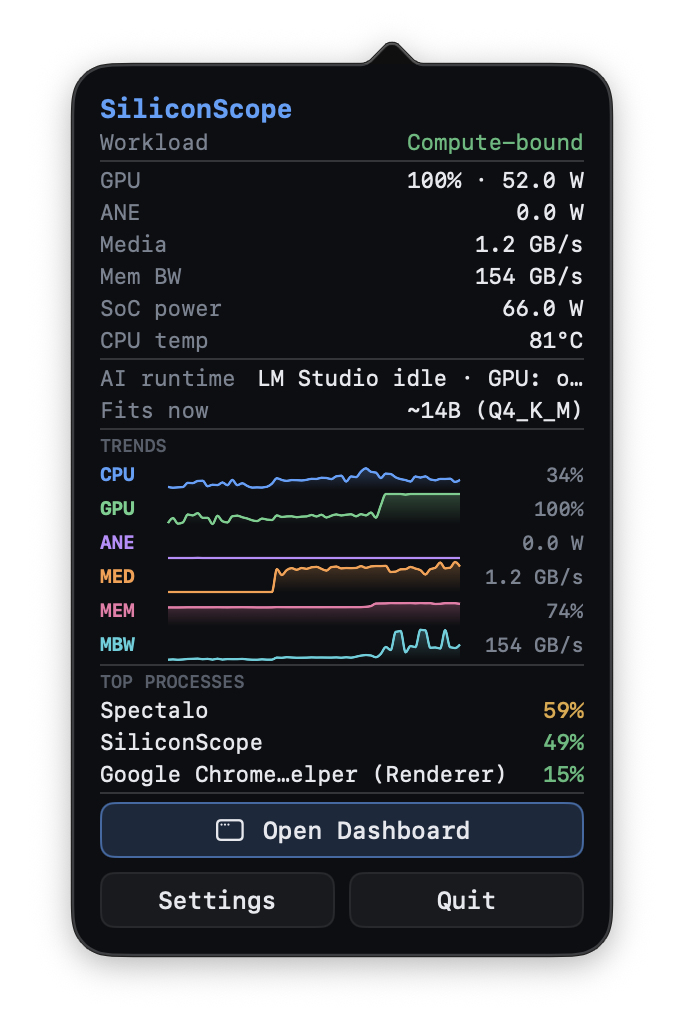
Your whole Mac in one glyph
The combined SiliconScope menu-bar item: live CPU / GPU / ANE / Media / memory bars plus bandwidth, and a dropdown with six color-matched 60-second trends, top processes, and the live workload verdict.
The metrics others hide
First-class Neural Engine and Media Engine power, plus unified-memory bandwidth with the CPU / GPU / Media split — the real bottleneck signal for on-device AI and video.
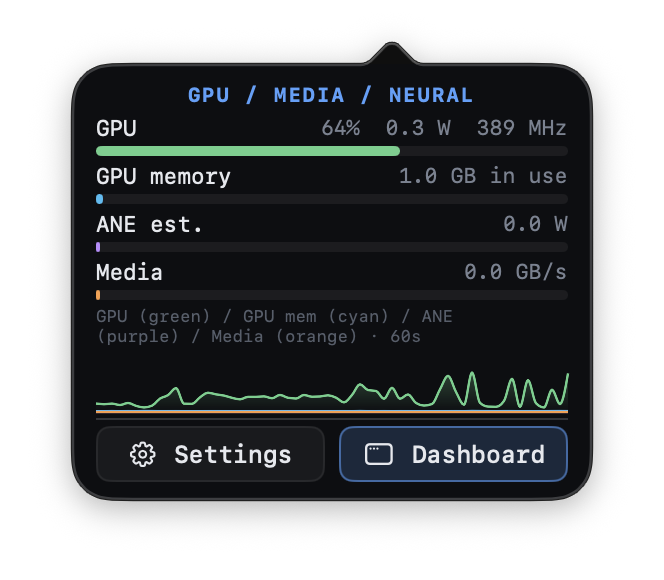
Bandwidth-bound or compute-bound?
A live verdict for your local LLM — bandwidth-bound or compute-bound — read against your chip’s spec bandwidth ceiling, plus a one-click tokens/sec + tokens-per-watt benchmark.

Pin any metric to its own item
CPU · GPU · Memory · Disks · Network · Sensors · Battery — each with a live glyph and a rich, iStat-style dropdown. Toggle any of them from the ⬚ on its dashboard card (or in Settings).


Nothing leaves your Mac
100% sudoless and offline by design — no telemetry, no analytics, no outbound calls. Open source, Developer-ID signed and Apple-notarized, and it updates itself.
Download
macOS 14+ on Apple Silicon. Opens with no Gatekeeper prompt, then auto-updates.
brew install --cask siliconscope